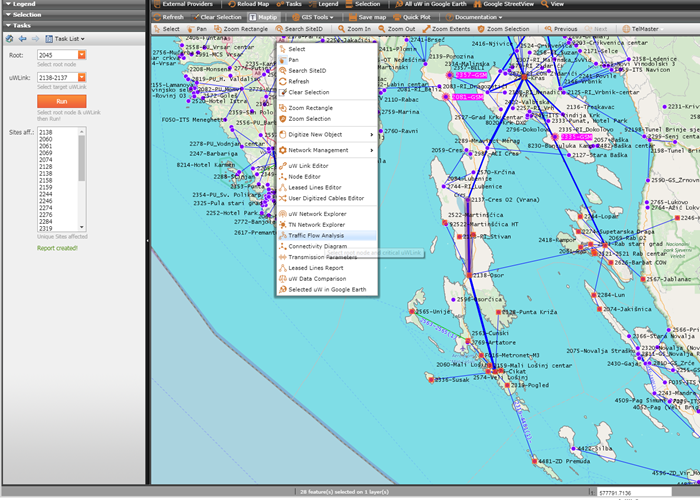
•Start analysis from the map context menu.
oSelect root node and target uW Link to be analyzed.
▪Traffic Flow Analysis user interface opens in Tasks pane.
•Two combo boxes are auto-filled with root node SiteID and uWLink ID.
▪Start analysis with Run button.
•Results are visualized on the map.
oBuffer is constructed around root node and critical uWLink.
oAffected nodes are highlighted and selected on the map for further processing.
oAffected SiteID's are listed in the list box in the Tasks pane.
oAffected uWLinks are filtered in the Reporting pane.

Figure 15: Traffic Flow Analysis. Affected nodes are selected.