•This report requires two configuration files from the Helix server.
oThe first file contains the maximum weekly utilization by WAN ports.
oThe second file contains biweekly throughput data for each TN / ML-WAN port.
•SSIS procedure on the staging server consolidate exports with relevant data in the TelMaster production database, namely;
▪The structure of the uW Network.
▪Exported SOEM configuration data.
•Subsequently, server procedure dynamically updates Helix Weekly Max Traffic GIS layer on a daily basis to visualize the network traffic load.
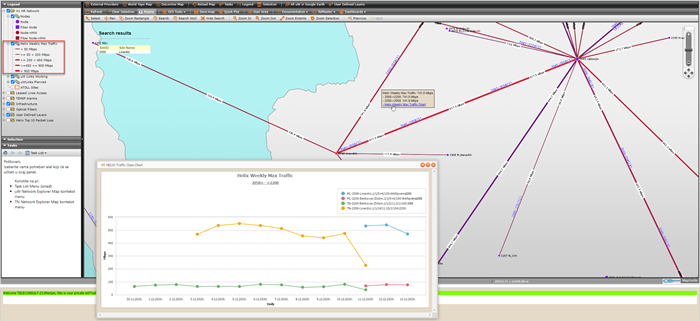
oThickness of the GIS layer vector as well as the color of the Helix Weekly Max Traffic layer is modulated with the value of the Max Traffic parameter.
▪The layer label shows the maximum weekly traffic from both directions.
▪The tooltip of the layer shows the maximum traffic in each direction also greater than these two amounts is defined as the Maximum Traffic and contains a link to the Helix Weekly Max Traffic Chart that opens in the popup window with daily traffic values for the last two weeks on each WAN interface.

Figure 16: Helix Weekly Max Traffic Chart opens in the GIS popup window and contains daily traffic values for the last two weeks on each WAN interface.